Stayed informed on whether you’re moving to a buyer’s market or seller’s market so that you’re prepared and ready when it is time to chat with a lender or real estate agent whenever you are ready for that new home location. Our real estate market data activity reports are available for the entire nation and are updated every Monday giving you the most current information on market trends around the country. There are different data points for Median list price, Average Days on Market, Price per Square Foot, Price Decreases and more. Examples below:
Links for the individual towns in Wilson Co, TX for their specific data are below: One can choose the report they want using the zip codes below. Following one link can access all zips. There is the real estate data for each of the real time market profile categories.
Floresville TX = 78114 La Vernia TX = 78121 Adkins TX = 78101
Poth TX = 78147 Stockdale TX = 78160 Sutherland Springs = 78161
Poth & Sutherland Springs are small towns with very few sales so the Market Data has a warning data about the lack of data for the best results.
Below is an example of the interactive market data charts. Follow the above Wilson Co link to access current information.

Below is an example of the interactive market data charts. Follow the above Floresville link to access current information.

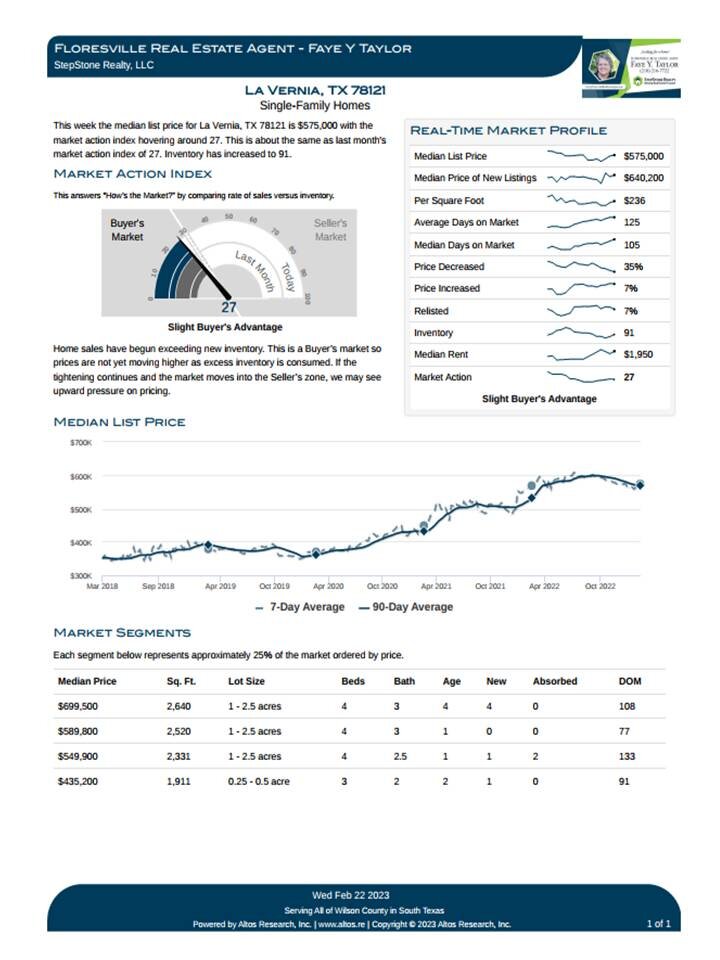
Current La Vernia Real Estate Data Market Activity Report Link
Below is an example of the interactive market data charts. Follow the above La Vernia link to access current information.
Below is an example of the interactive market data charts. Follow the above Poth link to access current information.

Below is an example of the interactive market data charts. Follow the above Adkins link to access current information.

Below is an example of the interactive market data charts. Follow the above Stockdale link to access current information.

Prior Year of 2019 Data
2019 DATA
Floresville Real Estate Statistics
The following chart is the data based upon average prices as of November 2019 From 2016 to 2019
All types of homes including manufactured homes, all price ranges, all sizes, all bedroom sizes.
Blue = Entire MLS Green = Wilson County Teal = Floresville
SABOR MLS = includes all of Bexar County and some the contiguous counties such as Wilson, Medina, Atascosa, Guadalupe, Frio, Bandera, Comal and Kendall listings. Some of the Guadalupe, Comal listings and some of the Kendall listings are not in SABOR as those Four Rivers MLS agents who list those homes do not list them in SABOR. A few of the Wilson county, Comal county and Bexar county listings may be listed in Four Rivers only so will not be reflected in the above data.
As you look at Floresville Real Estate data, you will note that Wilson county is moving upwards faster than the other SABOR properties. Floresville is behind the overall Wilson County increase because La Vernia property values overall are higher than Floresville. Two factors drive those values. La Vernia does sell at a higher price/ sf than Floresville on average but La Vernia has developed a greater number of higher priced subdivisions. That means that the higher priced homes are concentrated in that area of the county.